


Many people ask me this question, “Whether Intraday Trading really works?” whenever I introduce myself as an intraday trader.
Some people give free Gyan saying “intraday trading is risky, you lose everything if you try intraday trading”.
I have one suggestion for them.
They are not looking at the charts properly!
I do agree that intraday trading is one of the most robust types of trading in the market.
It demands a lot of clarity about trading systems, patience, persistence, effort, and focus, but keeping these myths in your mind is not a good idea.

Personality Traits of a Successful Intraday Trader
Before thinking to generate profits in intraday trading, one should know these points:
Clarity is the key — When you get into a lower timeframe, the risk always increases so is the reward.
One may play safe with swing trading, but quick money can be made with intraday trading (only if you are on the right side of the market) as theholding period is less.
So, traders should be ready to digest some failures.
Avoid Revenge Trading — Whenever we face a failure (small or big) in life, we feel bad.
It is because of our typical upbringing, and the same logic applies to tradingas well.
We all feel bad even if we lose only Rs.1,000 in a trade. Because it is not only about the money, it is emotionally difficult to accept the failure.
So, whenever a trader faces 2–3 failures, his mind aims to correct them by taking some unnecessary trades, which is nothing but revenge trading.
Over 90% of the traders lose money in intraday trading, because of revenge trading.
Stay Focused — In intraday trading, one should develop the skills demanded by the market and has to wait for better trade opportunities.
On many days we get better trade opportunities like Trend days which arenothing but a free-hit after a no-ball in cricket.
However a batsman can still get out on the free-hit ball by a runout and in the same way, a trend day opportunity may even fail sometimes, but doremember, that is an exception or a rare scenario.
So, always be prepared for an unexpected scenario.
Know when to leave the desk — The market is vastly dynamic and every day is not a trading day for traders.
One has to understand the market movements, style of trading instruments and should maintain an emotional balance.
Money Management Rule — You might have picked a good trading system that can appear to show a 90% success rate.
But one tweet from an influential person can change the fate of your trade.
Also, any natural calamities like an earthquake or war announcements between two countries can create an adverse impact on your trade.
So, what would happen if you had taken a risk of 25% (of your capital) in onetrade?
It will wipe out 25% of the money, and only four such trades are enough to wipe out your entire capital.
So always risk only 2–3% of your capital per trade.
Intraday Trading Systems
After understanding the above points, you can pick any intraday tradingsystem which has shown good results with historical data (a minimum of 5–10 years).
System #1 — Short Strangle Strategy (Options Selling)
Entry Time — 9.20 AM
Exit Time — 3.15 PM or SL
SL — 100% of the premium for both CE and PE
TSL Plan — If it hits SL on one side, it means the price is displaying a trending move in one direction. So trail SL for another leg to cost-to-cost (to avoid more loss).
I suggest using ATR to pick the strike prices.
I will take an example to explain the concept.
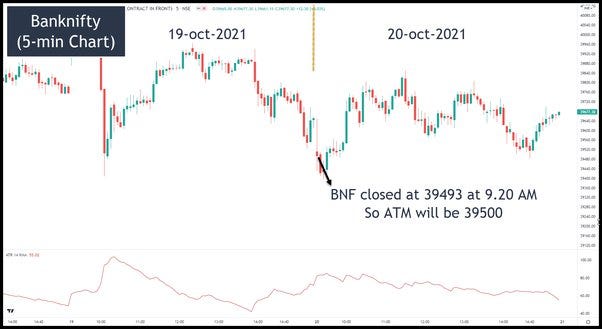
Image 1 — Banknifty 5-min chart on 20-Oct-2021
On 20th Oct 2021, Banknifty closed at 39493 at 9.20 AM. So if we round-off to the nearest strike price, then it will be 39500.
Now we need to sell both CE and PE around 39500. But how to pick therange?
This is where the Average True Range (ATR) indicator comes into thepicture.
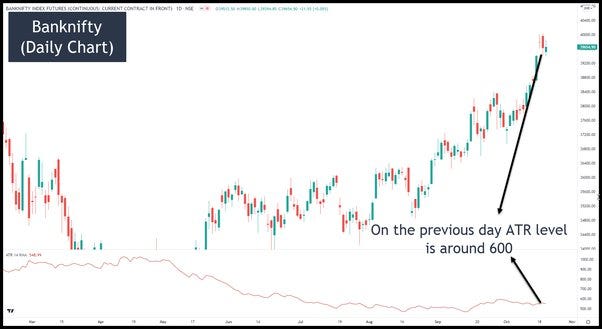
Image 2 — Banknifty Daily Chart
ATR is a volatility indicator that shows how much the price moves (on average), during a given time frame.
In the above case, the ATR level was 600 points approx on the previous day. It means there is a high probability of price staying within this range for today as well.
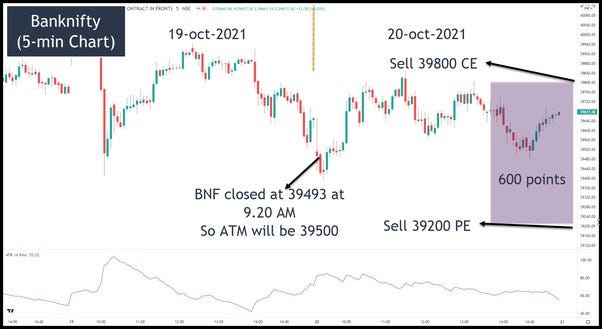
Image 3 — Short Strangle Strike Price Selection
So, we sell 39800 CE (300 points above from the close at 9.20) and 39200 PE (300 points below from the close at 9.20).
We need approx Rs. 320,000 (3.2 Lakh) to sell both legs (at the current rate of Banknifty).
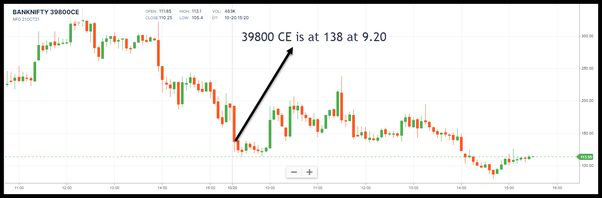
Image — Banknifty 39800 CE at 9.20
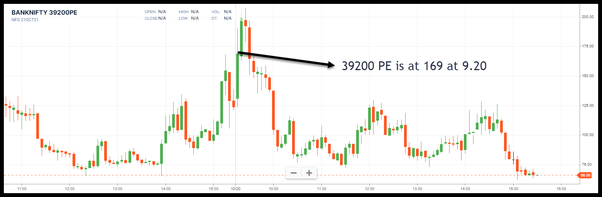
Image — Banknifty 39200 PE at 9.20
As shown in the above image, 39800 CE was at 138 and 39200 PE was at169.
So we keep a stop-loss for both legs at 100% of the premium.
SL for 39800 CE will be at 276.
SL for 39200 PE will be at 338.
Banknifty displayed a complete sideways move and hence it didn’t hit thestop-loss for both the legs.
39800 CE closed at 113
39200 PE closed at 66
So, the total premium decay is 128 points.
Profit is Rs. 3,200 (128 x 25 lot). Even if we exclude Rs.200 towards brokerage + taxes, it generated a profit of Rs. 3,000 (close to 1% on thecapital).
This strategy may not give similar profits every day. There is a possibility ofhitting the stop-loss of one leg and if we trail SL for another leg, we get a result of a small loss, or breakeven, or a small profit (due to time decay).
Besides, the decay will be faster on Thursday, Wednesday, but it will be slow on Friday and Monday.
So even if we get 10 profitable days in a month, we can make Rs.30,000 (1% returns) with a capital of Rs. 320,000.
Please backtest the strategy before using it and also there are many ways to improve the returns of this system.
.
System #2 — Credit Spread Strategy (both Intraday and BTST)
Please read the below explanation carefully.
(It has an old example when the Nifty has 75 quantity for 1 lot. Now Nifty is50 quantity per lot)
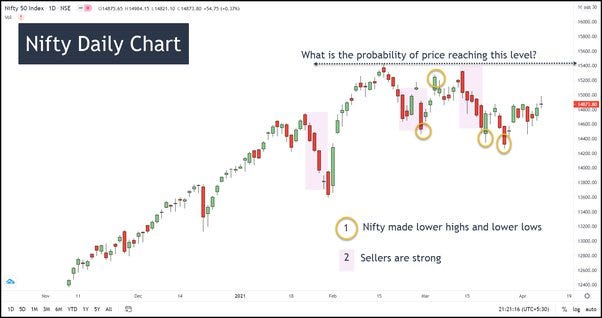
Image — Nifty Daily Chart as of 8-April-2021
The above image shows a Nifty Daily Chart.
Two things are very clear if we look at the chart:
- It has made lower lows and lower highs in the past few weeks and hence it is looking weak.
- A close look at the daily candles indicates sellers are strong on many days and buyers are weak (small green candles).
Then what is the probability of the price reaching the 15400 levels (black dotted line) in the next 5 trading days?
Very less, right?
Now, I will add one more point.
Fall happens very quickly, whereas, raise happens slowly in the market. Because “Fear” is more dominant as compared to “Greed”. Do you agree?
I hope by now, you have convinced that there is very little probability of price reaching 15400 levels in the next 5 trading days.
Can we assume that the price not reaching 15400 is 80% probability?
Now, have a look at the NSE option chain.
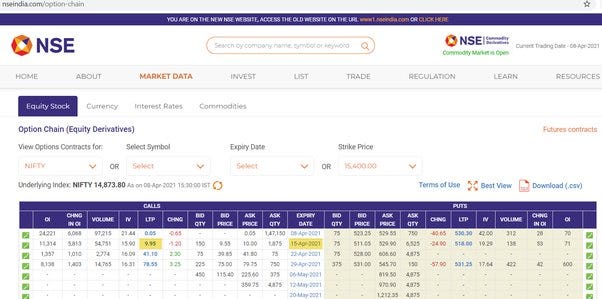
Image — NSE Option Chain for Nifty 15400 CE.
If we look at the NSE option chain for 15400 CE for 15-APR-2021 expiry, it istrading at Rs. 10 (9.95 precise).
So, if a trader sells this contract, he will get a premium of Rs.10 Immediately and there is a success rate of 80% (as per the above discussion).
Now, look at the option payout for Nifty 1 lot (75 Qty).
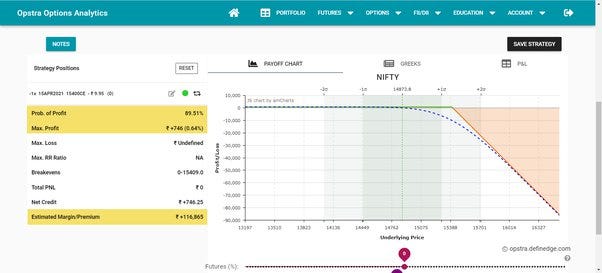
Image — Options Strategy P&L Simulator using Opstra Define Edge
The above image shows a few important things:
- There is an 89.5% probability of making a profit.
- The potential profit is Rs. 746 for 1 lot
- The margin required is Rs.1,16,865
- The potential loss is unlimited (because the price can go up to infinity)
As a trader, we need to avoid all the possibilities to lose big money.
In the above strategy, a trader can lose big money if the price starts to trade above 15400 (which is less probability).
So, we can keep a stop-loss at 50% of the premium.
It means the trader will close the trade (by buying back the 15400 CE) if theprice reaches Rs.15.
So, if he wins he will learn Rs.10, and if he loses he will earn Rs.5 which is a 1:2 Risk-Reward trade.
Most importantly there is a 90% chance of winning.
So, Rs. 746 is the profit for the capital Rs. 1,16,865 which is 0.6% returns on the capital deployed.
Common friends, it is 0.6% returns in 1 week with 90% accuracy!
I know, we would have been happier if the % returns are more.
There is a way for it.
We need to deploy a “Credit Spread strategy” to maximize the ROI.
In the credit spread strategy, instead of placing a stop-loss, we buy the deep OTM to define the risk and to reduce the margin requirements.
In the above example, along with selling Nifty 15400 CE, we buy Nifty 15600 CE.
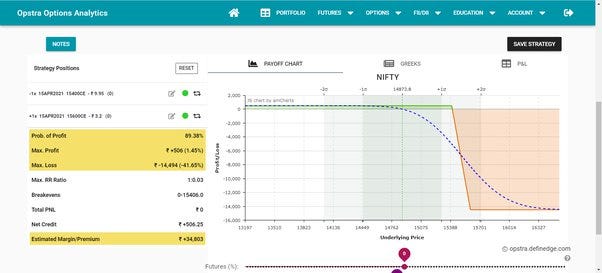
Image — Options Strategy P&L Simulator for Credit Spread
The above image shows a few important things:
- There is an 89.4% probability of making a profit.
- The potential profit is Rs. 506 for 1 lot
- The margin required is only Rs.34,803
- The potential loss is Rs. 14,494
ROI is approximately 1.5% on the capital. One can easily make it to 2–3% if we play around with the strike prices and different options strategies. But atthe moment, I will leave it as it is.
The only risk is the potential loss of Rs.14,494. It will happen only if the price starts to trade above 15400.
A trader can always close the trade if the price reaches 15400 within thenext 5 trading days (if it happens). In that case, it will be a breakeven trade or a small loss.
Below are the two important things to execute this strategy smoothly:
- Ensure not to risk more than 2% of the overall trading capital per trade
- Constant execution is the key
In the same manner, we can also deploy this strategy for intraday trades as well.
.
System #3 — Moving Average Systems
Below are the 3 different intraday trading systems based on different moving averages.
Case 1–30 Period EMA
This is a simple intraday system using 30 Period EMA.
Timeframe — 15 Min chart
Instrument — Banknifty Futures
Entry — When the candle closes above 30 EMA and when the price breaks the high of that candle (opposite for short trade)
Stop-loss — 0.1% SL from the Entry Price
Exit — SL or EOD exit
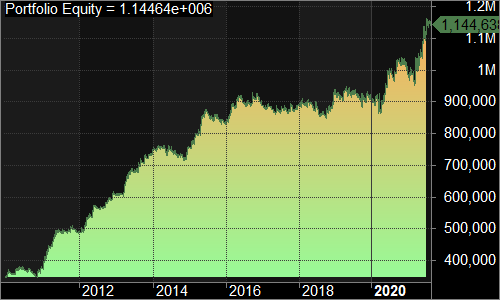
Image — Equity Curve
Starting capital — 350,000
Ending Capital — 1,144,000
Position Sizing — Fixed 2 lots
Total number of trades — 1902 (16 trades/month)
Accuracy — 18%
Profit Factor — 1.36
ROI — 11% per year
Maximum Drawdown — 8.9%
Case 2–5 Period EMA and 50 period EMA
This is a simple intraday system using 5 and 50 period EMA crossover.
Timeframe — 15 Min chart
Instrument — Banknifty Futures
Entry — When the 5 EMA crosses above 50 and when the price breaks thehigh of that candle (opposite for short trade)
Stop-loss — 0.5% SL from the Entry Price
Exit — SL or EOD exit
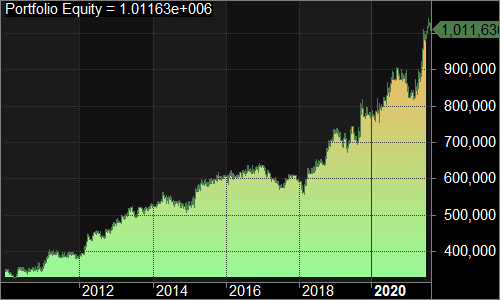
Image — Equity Curve
Starting capital — 350,000
Ending Capital — 1,011,630
Position Sizing — Fixed 2 lots
Total number of trades — 913 (8 trades/month)
Accuracy — 42%
Profit Factor — 1.31
ROI — 9.6% per year
Maximum Drawdown — 13%
Case 3–4 Period EMA and 33 period EMA
This is a simple intraday system using 4 and 33 period EMA crossover.
Timeframe — 15 Min chart
Instrument — Banknifty Futures
Entry — When the 4 EMA crosses above 33 and when the price breaks thehigh of that candle (opposite for short trade)
Stop-loss — 0.2% SL from the Entry Price
Exit — SL or EOD exit
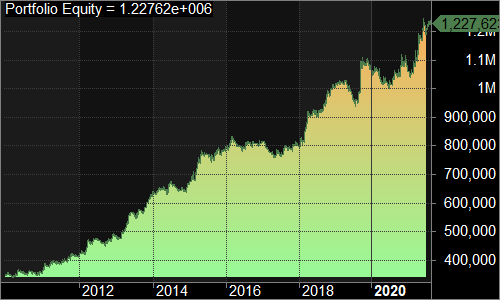
Image — Equity Curve
Starting capital — 350,000
Ending Capital — 1,227,620
Position Sizing — Fixed 2 lots
Total number of trades — 1318 (11 trades/month)
Accuracy — 28%
Profit Factor — 1.41
ROI — 11.5% per year
Maximum Drawdown — 9%
The above post was shared by our guest author Indrazith Shantharaj, Trader & Best Selling Author at www.profiletraders.in
If you liked this article, please do share it (Whatsapp, Twitter) with other Traders/Investors.
Nothing is clear. What ce and pe. It is not a simple day trading like buy and sell.
Please guide me for a small trader with investment of 5k daily through angelone for Short Strangle Strategy (Options Selling)
FnO Trading requires minimum capital of 3 lacs
Excellent article. Superb
Knowledgeable trading techniques. Still simple by just buy and sell depending on spread and movement possible?
Sir I want to learn how to think & develop different strategies.
Please refer https://squareoff.in/how-to-develop-a-winning-trading-strategy/