
- July 29, 2020
- admin
- 3
Many times we read about some strategy, then we test it with our historical data to see if its working fine or not. But the ideal way to find the best strategy, is first observe how the markets react with huge historical data sets, find if there are any repeated patterns, if there is any statistical significant evidence you find, then try to create a strategy out of it. That’s how we should design a trading strategy.

If we can run a detailed 10+ years of intraday historical analysis to find during which time of the day, maximum number of times Day high or day low is formed, then we can easily create a strategy out of it.
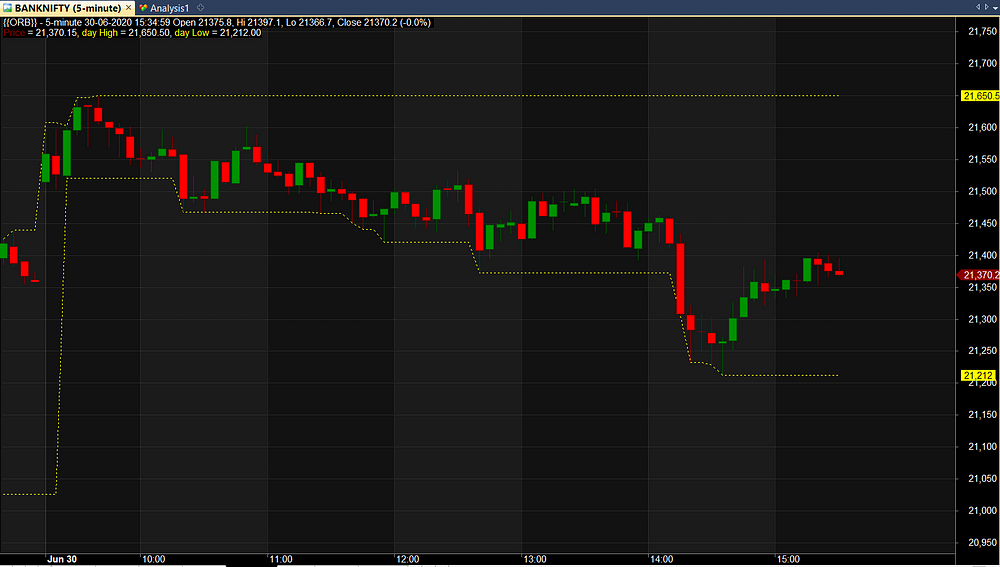
This is an Intraday chart of Bank Nifty which shows day high as 21650 that was formed around 9:45 am, after that market never crossed that high mark and day low was formed only around 2:40 pm in the noon and after 2.40 pm market did not go down further. This is just for one day, if we could run this analysis for 10 years and see during which time day high or day low is formed maximum number of times, then we can devise a strategy from it.
I ran a 15 mins time frame analysis to find what is highest high of the day as on specific time and whats the actual day high for the day, so this program will check what is the highest price so far, from time to time. Below example was considered on 29th June 2020, where high price is checked every 15 mins and next column is the actual day high for that day as per EOD data. The high for 29th June 2020 was 21440.05.
So now we need to find at which time this high was achieved, we recorded the high price from morning to evening, market was moving higher from 21309 and that was the high price till 12.45 pm, then new high formed, then by 3.30 pm high of 21440 was achieved and that’s the day high. only by day end, this high was achieved
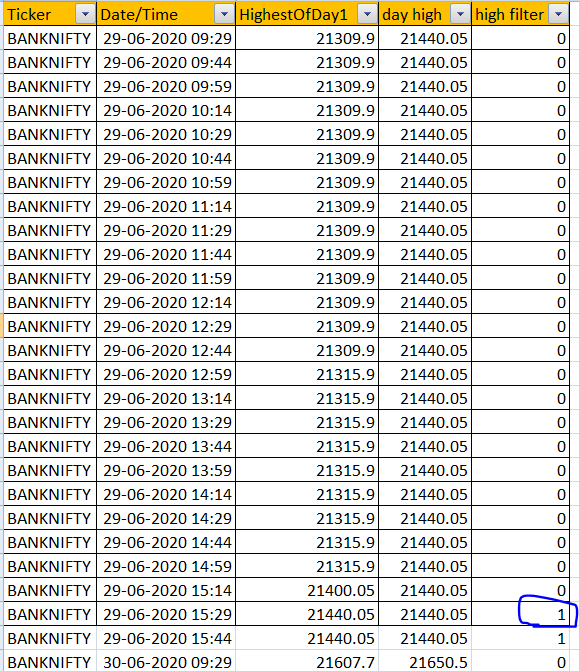
As per our analysis, for 29th June 2020, the day high was achieved on 15:30 pm, like wise we repeat this for day low as well
I ran a 15 mins time frame analysis to find what is lowest low of the day as on specific time and whats the actual day low for the day, so this program will check what is the lowest price so far, from time to time. Below example was considered on 29th June 2020, where low price is checked every 15 mins and next column is the actual day low for that day as per EOD data.
The low for 29th June 2020 was 21026.45. So now we need to find at which time this low was achieved, we recorded the low price from morning to evening, then new low formed at 10.30 am, that was the time, day low was achieved and market never went below that after that.
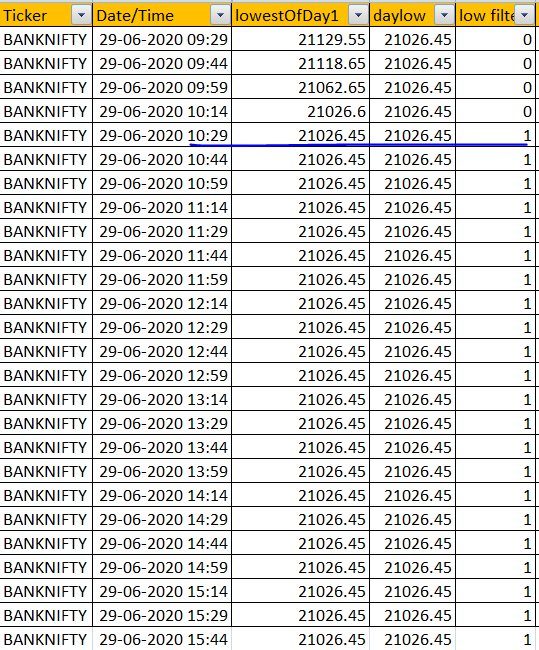
Once I gather the above data, I just have to remove the duplicates and take only the first occurrence. In above example, day low was first formed at 10:30 am, and rest of the day, that low was never broken. That level stayed as day low for rest of the day. So we note down 10.30 am is when day low occurred. We gathered this data for last 10+ years, and here’s the result.
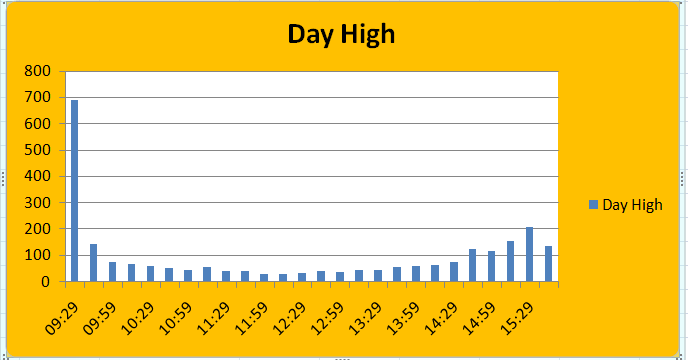
Day High:
Out of 2545 days, almost 836 days, day high was formed in the first 30 minutes itself, which is 33% of the time, Day High is formed before 9:45 AM.
And after 2:45 pm, 743 times day high was formed, which is around 30% of the time. So in total, 63% of the time, day high formed either during the first 30 mins of the day or during the last 30 mins of the day.
Day Low:
Similarly Out of 2545 days, almost 813 days, day low was formed in the first 30 minutes itself, which is 32% of the time, Day low is formed before 9:45 AM.
And after 2:45 pm, 719 times day low was formed, which is around 28% of the time. So in total 60% of the time, day low formed either during the first 30 mins of the day or during the last 30 mins of the day.
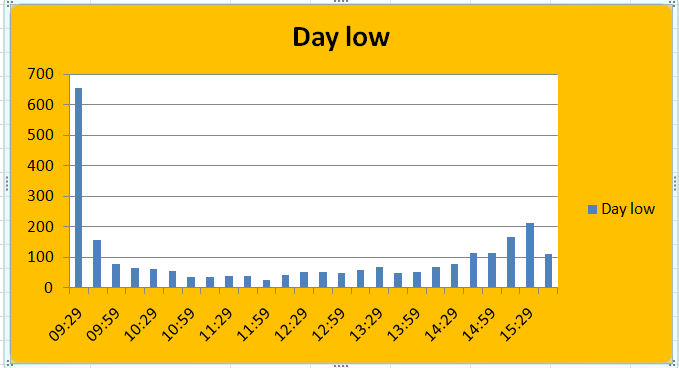
What does it indicates?
The maximum trending moves happen during first 30 mins or last 30 mins, mostly market stays in range bound from 10 am to 2:30 am. Probability of market making significant movement during 10 to 2 pm time frame is very less, so any short straddle or short strangle with fixed stop loss would do well during this period.
If you want to deal with buying options, then you should stick to 9:15 am to 9:45 am and from 2:45 pm to 3:30 pm, this is when maximum number of times day high or day low was formed, which means maximum number of times one sided direction has taken place, option buying with fixed stop loss during first half an hour or last half an hour should do well.
This analysis also clearly indicates why ORB works so well. The first 30 mins could decide the range for the day, when the range is broken on either side, we can expect the market to move in that direction for rest of the day. Simply find the day high or day low, for first 30 mins, if high is broken, then short the ATM Put option, exit it from if market reverses and breaks 30 mins low. So stop loss should be based on the underlying you trade, when it breaks 30 mins low, exit the put option you shorted and short the call option. Follow the same stop loss method.
Even famous Trader Linda Raschke once shared her insights in a podcast where she mentioned that, she specifically focus on market moves during each time frame and their team had did analysis on similar structure with tremendous data sets to find during which time frame market makes day high or day low. And she also found that first 30 mins played a vital role on deciding how markets would perform for rest of the day.
This should definitely work with both Nifty and Bank Nifty options, but never trade this method in futures, as your cost and slippage could be lot higher as no of trades is higher with this method. If you liked this article, please do share share it (Whatsapp, Twitter) with other Traders/Investors.


Super article
As per this , if we want to sell strangle then best time would be 10 to 2:30 pm right
Thanks for the info, but I think one more analysis u did that in last 45 minutes also there won’t be any movement in market in urs different article, plz share ur insight on this thing.