


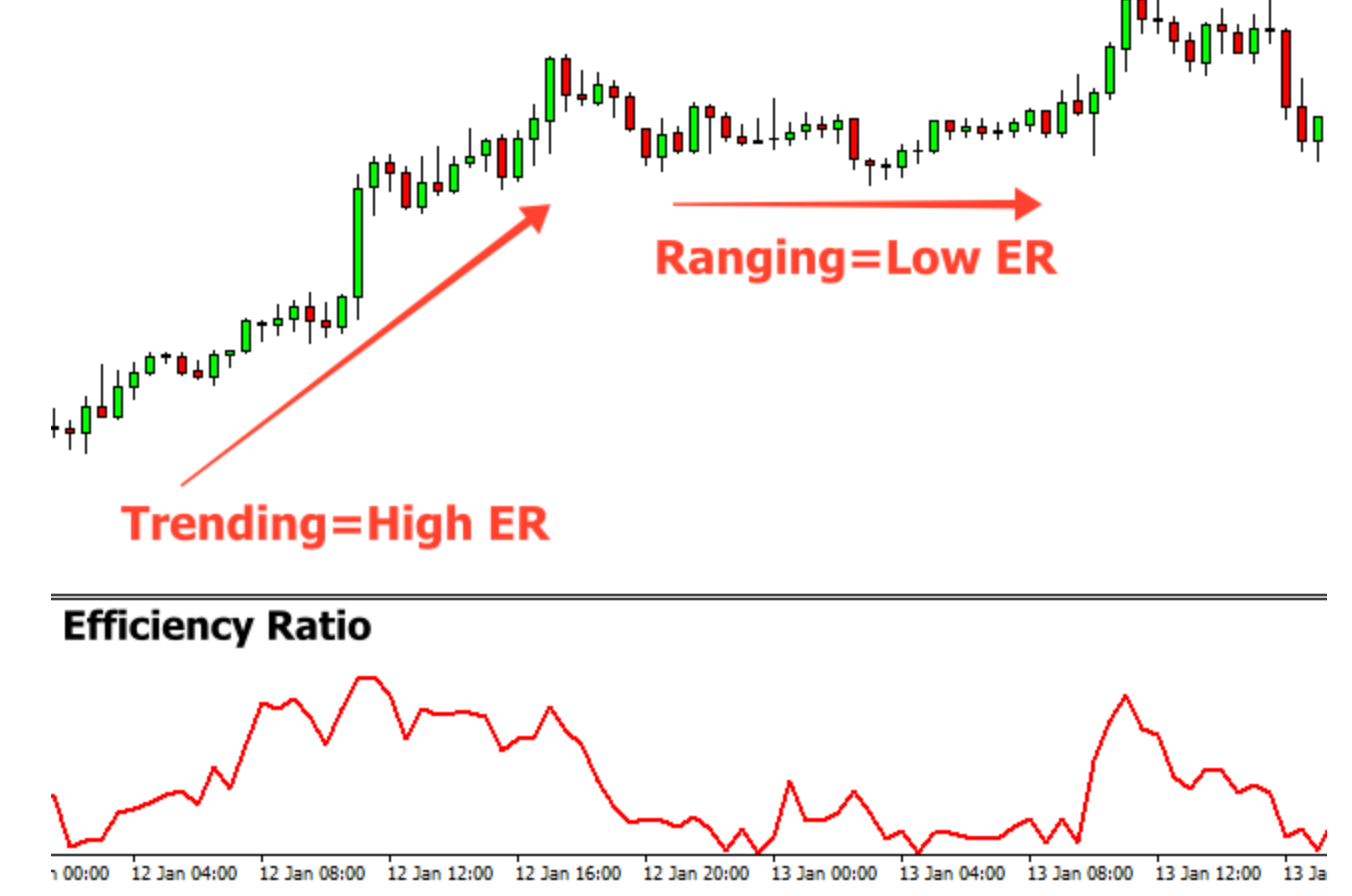
Seeing a chart pattern anyone can easily identify the difference between a trending market and sideways market. But I was wondering if there a way to identify it through quantitative mechanism? That’s when I read about The Kaufman Efficiency Ratio.
The Kaufman Efficiency Ratio trading strategy is based on Perry Kaufman’s market efficiency model as described in his book “Smarter Trading: Improving Performance in Changing Markets”. It is an interesting way to identify and measure the trend of a financial instrument. “The trend is your friend” is a classic trader saying. It implies that trading in the direction of the trend is a safe, conservative approach. However, to follow the trend it is necessary to separate the trend from the random noise of the market — i.e. the random movements of the market at any given time. Kaufman, using his ER, shows if a market is trending or not.
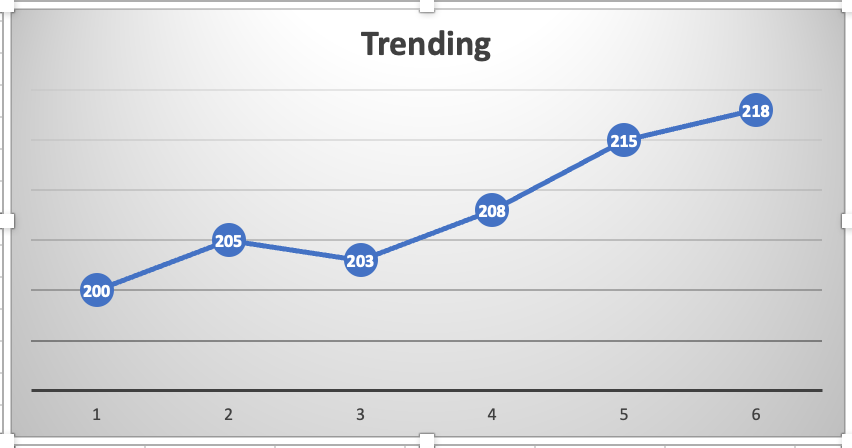
Consider a stock price moved from Rs.200 to Rs.218, that’s a 9% increase and chart clearly shows its trending.
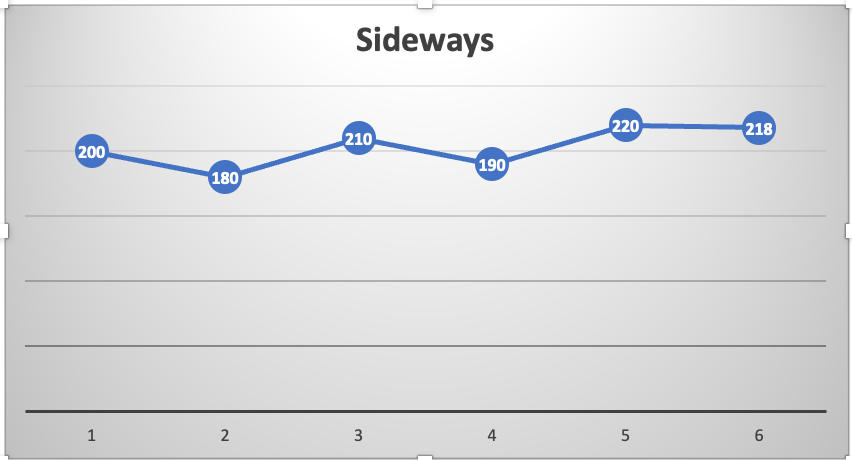
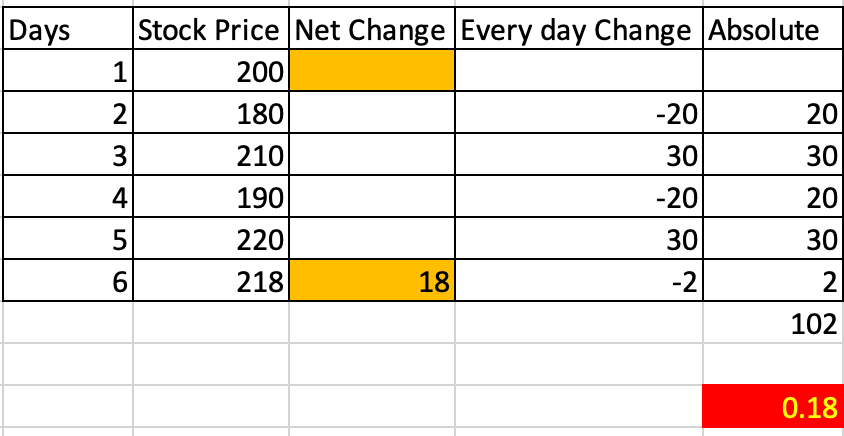
Consider the same stock price moved from Rs.200 to Rs.218, same 9% increase but the movement is non linear. The same appreciation in stock price happened with lot of volatility in between. Even though the overall movement is same, we consider this move as non trending/sideways, this is the phase where most of the breakout/trend following system suffers due to multiple failed breakouts.
This is where Perry Kaufman Efficiency ratio greatly helps
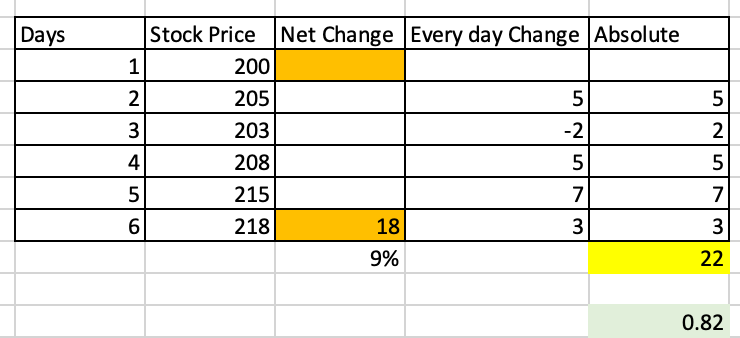
It is calculated by dividing the net change in price movement over N periods by the sum of the absolute net changes over the same N periods.
Consider the below table, plotted daily close price of a stock. We wanted to calculate whats last 5 days change in price. So 218–200 = 18. That’s the net change. Now calculate every day change in value.
205–200 = 5
203–205=-2
208–203=5
215–208=7
218–215=3
Absolute summation of all these above value is 22. To calculate efficiency ratio = 18/22= 0.82.
The more the value is closer to 1, we can consider the current market to be in strong trend. If the value is closer to 0, then we can consider the current market to be in sideways or non trending.
If the same calculation is done for a non trending series, this how the efficiency ratio looks like, its 0.18.
This Kaufman efficiency ratio is already available in Tradingview. What i have observed so far is, whenever the efficiency ratio comes near to zero levels, volatility subsides and market resumes its trending nature. Similarly whenever the efficiency ratio goes near 1, slowly the volatility comes and the trend fades away.

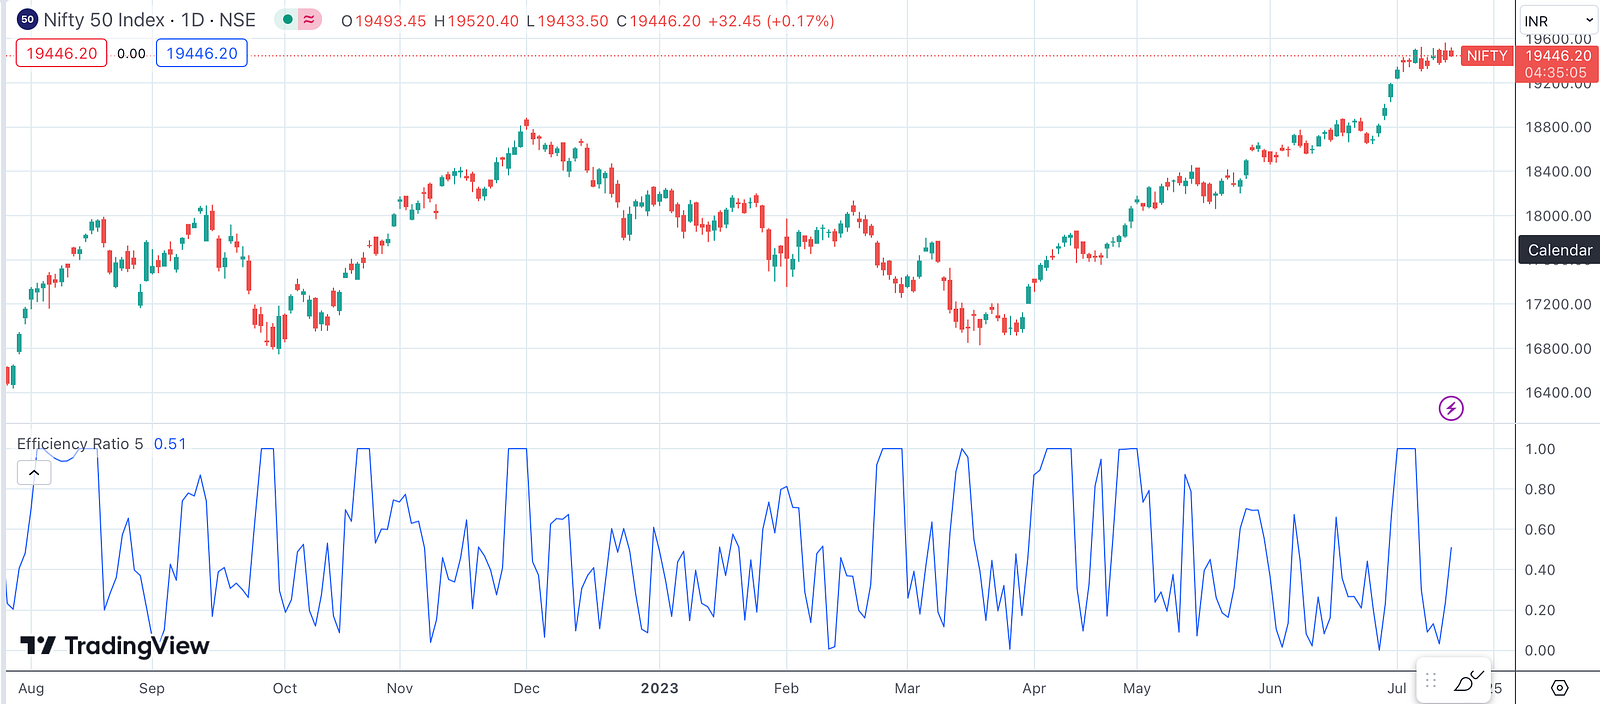
We cant use this as a standalone indicator, but it helps in identifying current market structure. Traders who run multiple trading strategies and looking for a filter to identify trending market and non trending market can use this ratio and accordingly deploy their trading strategies. It greatly helps in reducing the noise and identifying trend zone.
gr8 article, keep the good work going.