- August 17, 2020
- admin
- 6
We always hear this quote in trading, “Buy low, Sell high”. “Buy the fear, Sell the Greed”. So I wanted to test the scenario of what if we Buy top loser from the Fno Stock list and sell it next month. There are 150+ stocks in FnO list, among this list, we will find which stock has lost the most in a month, and buy that in cash segment. We will hold that stock for one month and exit it after a month, and again find which stock lost the most, repeat the process month after month.

So I took data from 2008 to 2020, and also considered FnO list of stocks that belongs to those specific years, if we take current FnO list and test the scenario, it would end up in survivor bias, and wouldn’t give us the correct result, so it is essential to test the rules with correct list of stocks.
Rules:
- Find the top loser from the FnO stock list at the end of every month.
- Buy that ONE stock and exit it after a month.
- Repeat the process.
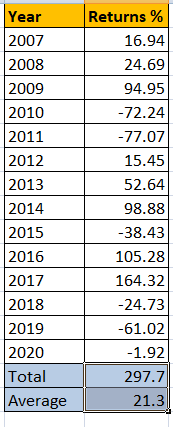
In the below table, returns has been calculated month after month from 2007 Jan onward, Yellow column denotes the % returns for the month, as per the rules, we take the top loser, so as per the historical data Renuka Sugars which was part of FnO stock list 2007 was the top loser for Jan month with -25%, so we bought that at 16.6 Rs. and we exit it next month at 15.1.
It ended up in loss, but out of 12 months, we would be able to capture some big winning stocks, like SRF in March 2007, Sun Tv in May 2007, all these returned much higher returns.

The strategy has returned 260% returns over all from 2007 to 2020 with yearly average returns of 21% .However, if you note years like 2010/2011 it has given huge loss.

Conclusion:
Buying the loser and selling it next month has shown positive returns over all when tested with 13 years of data, we can conclude there is some trading edge here, however we need to add more filters/rules to bring down the draw down, so that risk is lesser.
In above analysis, we did not use any stop loss, we just buy and exit next month, if we use a fixed stop loss, it can reduce your risk to a greater percentage. You can try adding your own set of rules to this logic and make it more robust. If you liked this article, please do share share it (Whatsapp, Twitter) with other Traders/Investors.


very goood analysis .. i alwys like to read ur blog..
i have clear one thing ..if any retaile investor invest say 100 rs the what will be the present value if componding is donw.
year
2007
Very good analysis
Lets say if someone invested Rs.100 in year 2007 and then doing compounding every year, then what will be the present value?
Year return value of investment at year start value of investment at year end
2007 16.94 100 116.94
2008 24.69 116.94 145.812486
2009 94.95 145.812486 284.2614415
2010 -72.24 284.2614415 78.91097615
2011 -77.07 78.91097615 18.09428683
2012 15.45 18.09428683 20.88985415
2013 52.64 20.88985415 31.88627337
2014 98.88 31.88627337 63.41542048
2015 -38.43 63.41542048 39.04487439
2016 105.28 39.04487439 80.15131814
2017 164.32 80.15131814 211.8559641
2018 -24.73 211.8559641 159.4639842
2019 -61.02 159.4639842 62.15906104
2020 -1.92 62.15906104 60.96560706
Thanks for sharing valuable information 🙂
Hi, How will we get this data? i.e. FnO list of stocks for previous month.
Its available at nse website
I tried on NSE, but can you help me narrow down the link or data?