


Here’s the last 20 years data analysis on Nifty data.
We have been continuously reading headlines about Nifty trading at all time high PE levels and valuations are expensive, or more selling expected due to higher PE ratio. First to explain simply, PE ratio implies the amount an investor is willing to pay to earn one rupee as profit.
For example, if PE ratio of a firm is 25 it means that investors are willing to pay Rs 25 for Rs 1 profit the company earns. Similarly, if the PE ratio for Nifty stands at 29, investors are willing to pay Rs 29 for one rupee profit collective earned by all companies that comprise the Nifty index.
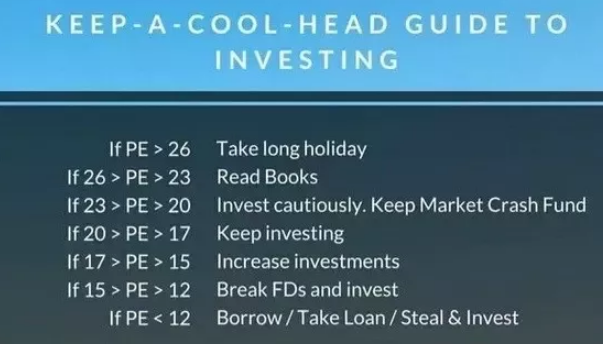
In fact, if we analyze the historical data of Nifty pe ratio, it is clearly evident that if PE ratio is greater than 26, then markets are highly over valued, its better to exit all your holdings and move out of markets.
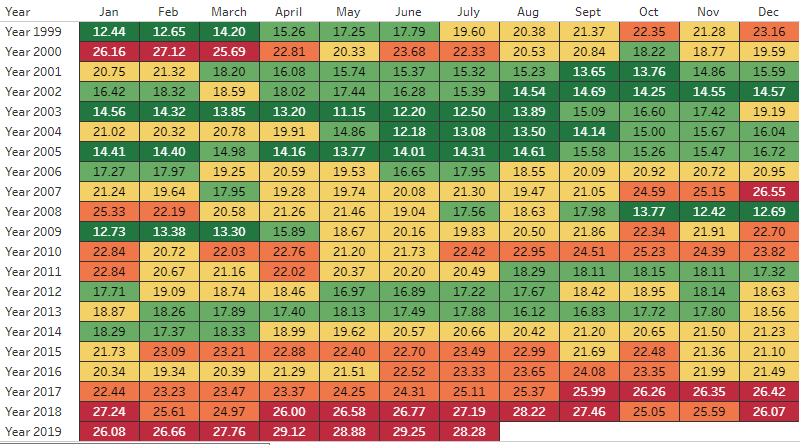
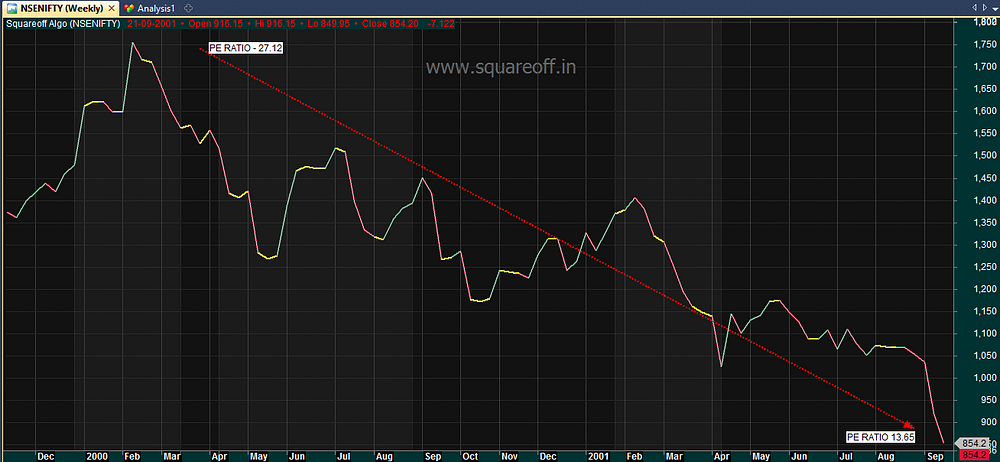
This is the Nifty PE ratio chart for the last 20 years, there are two major stock market crash happened in these period. One was 1999/2000 dot com bubble and another one is 2007/2008 Global financial crisis. If you observe the chart, Nifty PE ratio started becoming expensive by late 1999. And market started crashing in year 2000, from 1800 to 850 levels, Nifty corrected around -52%.
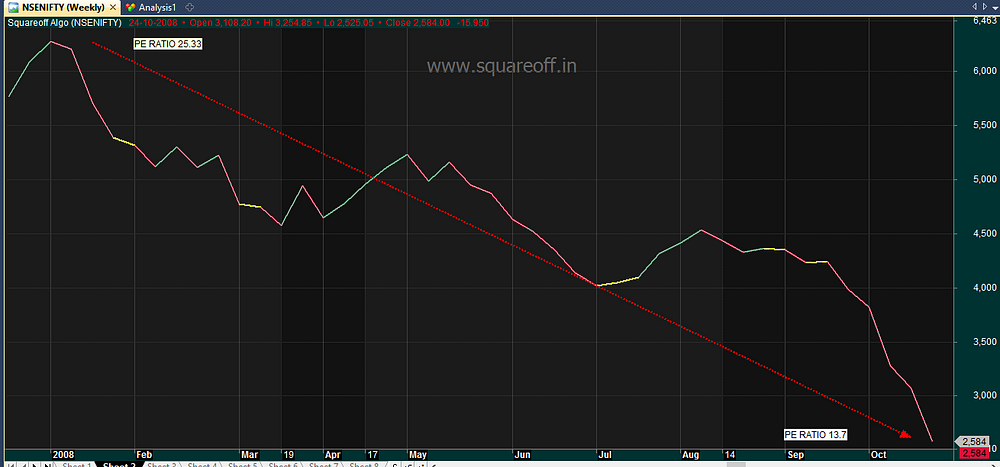
Similarly market started becoming more expensive by late 2007, Nifty PE ratio was much higher than earlier bull period and again market crashed in year 2008. It was more severe than earlier crash, where market corrected from 6300 levels to 2200 levels, its a -65% correction.
If we go by the same logic, Nifty started becoming more expensive by late 2017, so we should have faced market crash by year 2018.
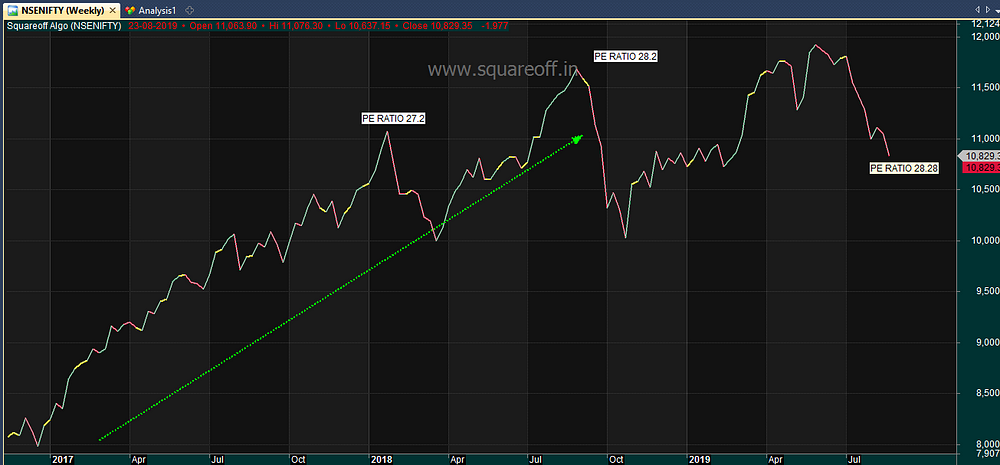
But it did not happen. In fact, Nifty climbed even much higher than 2017 levels and went onto hit all time high of 12000 in Nifty. Its because, just the mere PE ratio isn’t enough to conclude if market is over valued or under valued. We need to look beyond, and the PB ratio historical data could give us the answer.
The Price-Book Ratio is another way to evaluate the value of a stock or an index. Thus a low P/B ratio less than 3 indicates markets is in value zone, whereas a high P/B ratio more than 4 indicates expensive zone.
Here’s the Nifty PB ratio chart for last 20 years
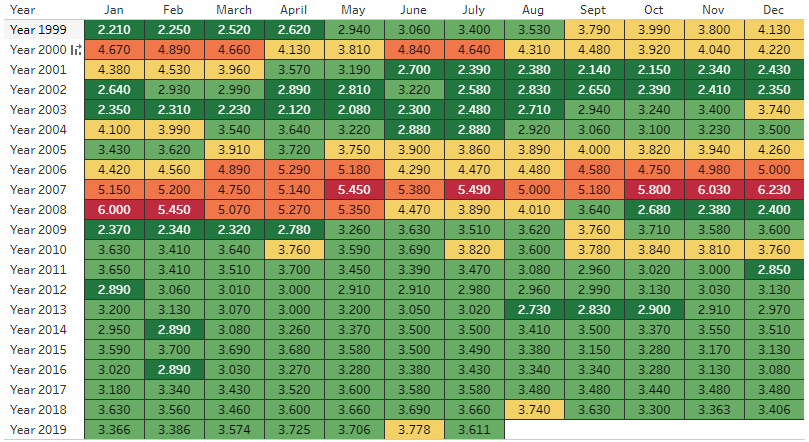
What we can observe here is the year end 1999 and start of year 2000 Jan, PB ratio has become very high, it was above 4 and that followed by market crash, correcting significantly.
Again from year 2006, market through PB ratio started giving warning signals and the year 2007, the full year, PB ratio nifty stayed in expensive zone, by year 2008 Jan, it reached the peak PB , where the peak value of pb ratio 6 was 30% higher than the earlier peak levels of year 2000 PB ratio.
But after that, our markets never went into over valued zone as per pb ratio. It is still less expensive compared to 2008 levels or year 1999/2000 levels.
Even though comparing only Nifty PE ratio could show that Market in danger zone, but when we compare it with PB ratio, Nifty isn’t as expensive as the prior crash periods.
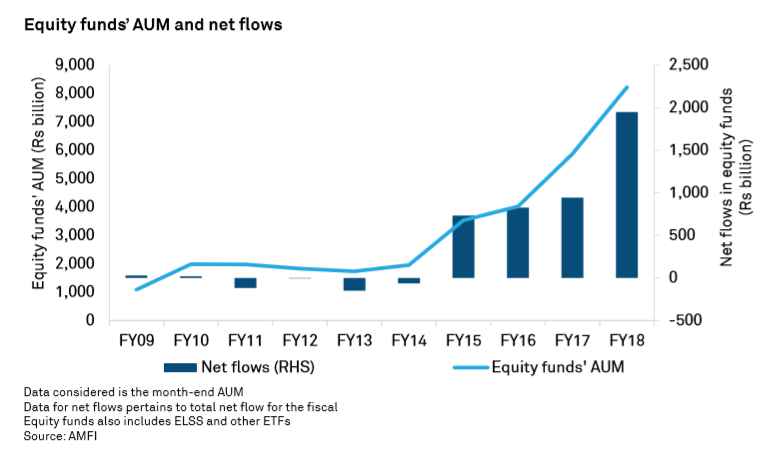
Data shows that Indian investors investing through mutual funds has been increasing steadily over the years.

As economy grows, more companies comes into the market and even more investors gets into the market, it is clearly evident from the increasing percentage in Asset under management in these equity mutual funds.
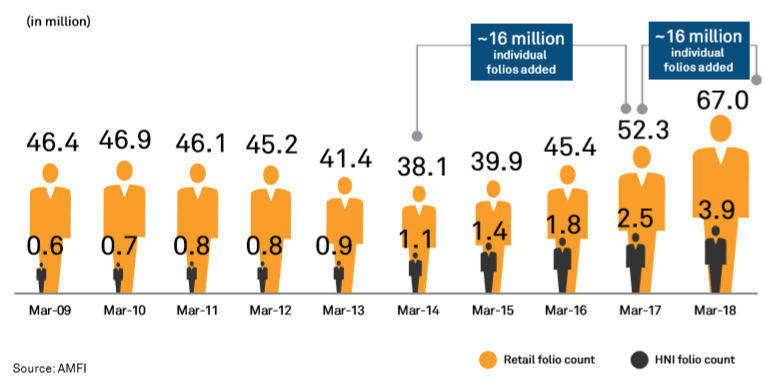
Even no of individuals who invest through mutual funds are at high levels now.
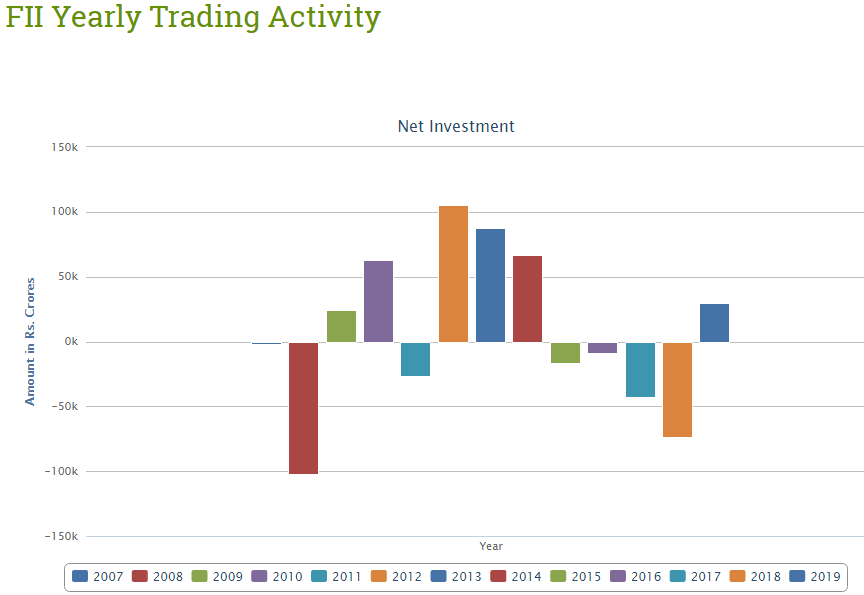
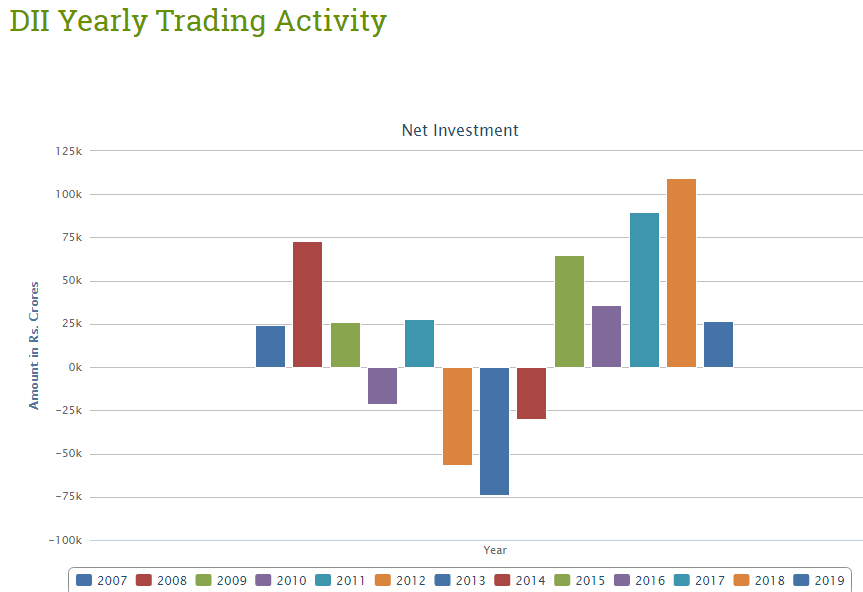
The mutual funds sahi hai advertisement must have brought in more first time investors into the market and this steady inflow of money makes the DII as net buyers most of the time, whereas the FIIs have been net sellers for past few years.
So the real problem isn’t actually going to be purely based on Nifty PE ratio or PB ratio, even though as per Nifty PB ratio, we are relatively not in over valued zone yet, the actual problem arises when these first time investors who haven’t seen bigger volatility in markets, go for redemption once sentiment turns bad in market, it creates huge liquidity pressure and amplifies the situation making the fall more severe when it happens. That’s why market crashes are always significantly higher than the one we witnessed earlier.