- January 8, 2021
- admin
- 1
Since the current market is being compared with 2004–07 bull run period, lets look at the historical data to see how a bull market looks like? Does market keep moving up? How often does a market correct in a bull market? Do we really know when the bull market ends?
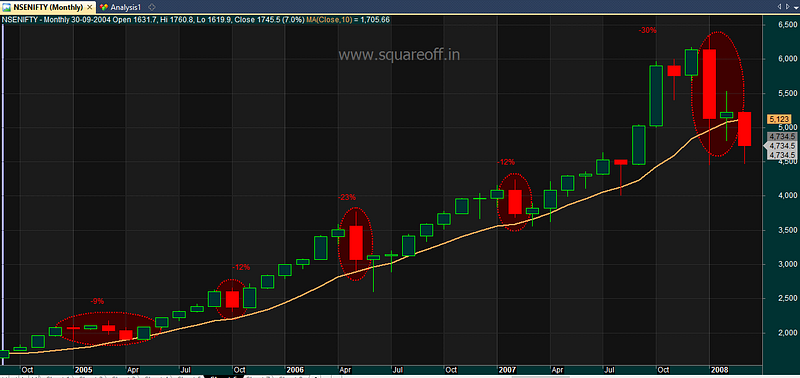
Here’s the Nifty chart from 2004 to 2008, where Nifty moved from 2000 levels to 6400 levels in just 4 years, that’s 220% index returns. If you observe the below chart, you can see that there were 4 small corrections from (-9% to -23% ) through the bull market period which finally ended in 2008 with biggest one month fall of more than -30% from peak in Jan 2008. Also throughout this period, market never closed below 10 months moving average on monthly chart, only on March 2008 it closed below 10 month moving average that signifies the end of bull market.

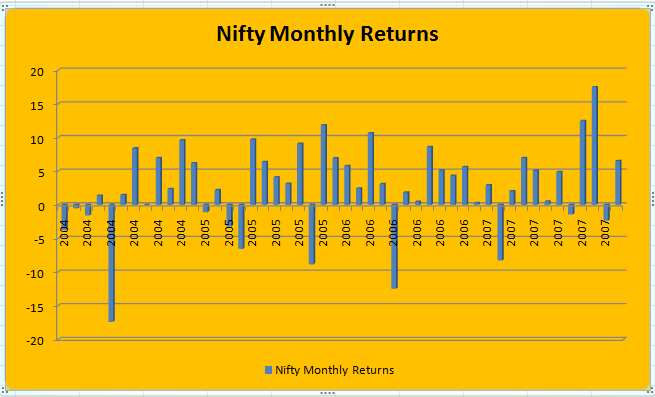
Here’s the Nifty monthly return chart, most of the time on monthly basis it has always closed on a positive note, where most of the time it closed above 5% on monthly basis with very limited downside, where only 5 times in 4 years it closed below 5% on a monthly basis.

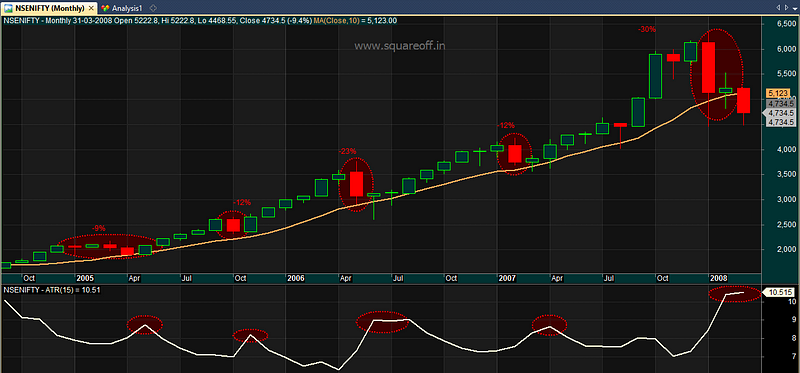
If we check the ATR(Volatility) of the index, its been on steady decline ever since market started its up move, only when there were mild corrections, ATR moved up and showed some higher volatility. Eventually once the corrections are over, market resumed its uptrend and ATR resumed its downtrend. Only on JAN 2008 after the market crash, market declined and ATR hit all time in last 4 years.

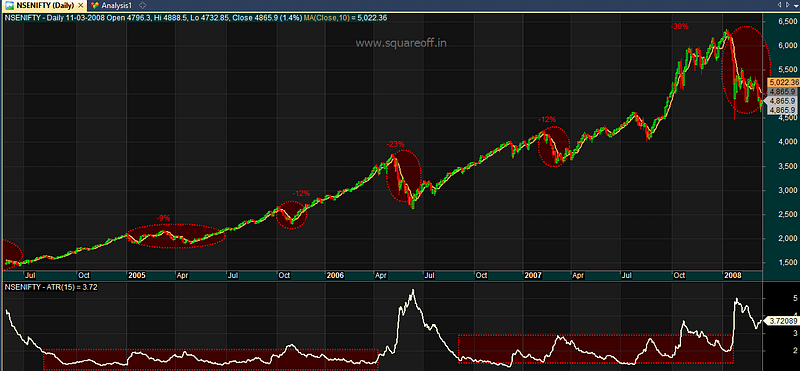
On a daily time frame, this is how the market looked like, where market even though it climbed up most of the days, the volatility or range was compressed and it remained in narrow range for multi years. When there was a correction period, expansion of volatility (ATR) short lived for two months and again volatility reduced and remained in narrow range for multiple months.

I have written an article in April 2020, that our stock market is bottomed out https://squareoff.in/is-the-stock-market-bottomed-out/ by comparing historical data sets, the reduction in VIX confirmed this study that our market is ready for up move from April 2020. We are at the start of a big bull run that can last for next few years.
- Every dip is an opportunity to invest.
- Every negative news will be ignored by the market, you might wonder how the hell market is moving up with such negative news.
- Many stocks which were just sleeping for many years would all of a sudden start its upmove.
- You can witness many small cap stocks making more than 500% returns in coming years.
- In a bull market, any stock that you buy goes up. It makes the beginners think that investing simpler and easy to make money in markets until the bear market comes in punches them in face real hard.
- Build a investing plan, with a mix of 60% large cap, 30% mid cap and 20% small cap stocks. Have a exit plan the moment you enter these stocks and ride the trend.
- Do not simply exit you holdings with 20%, 30% targets. This is the period to make 3 digits returns by holding your portfolio for little longer period.


Very good insight