


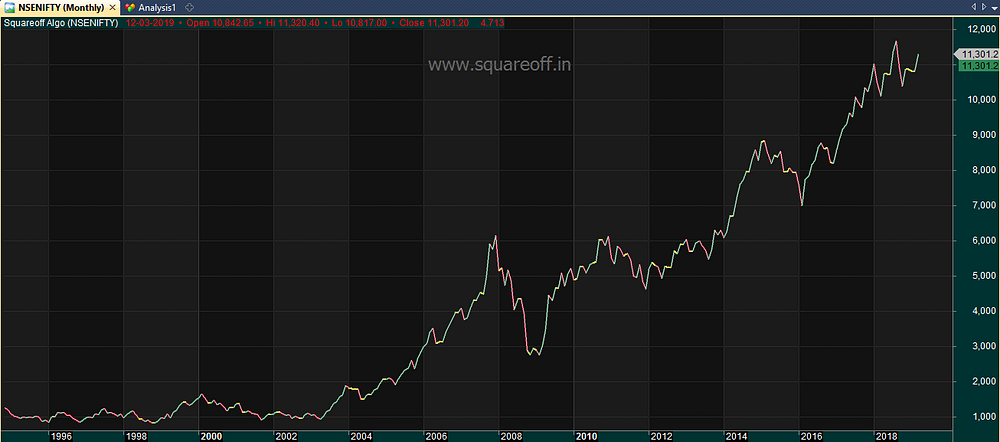
Markets always gets into different cycles, contraction and expansion. Where at times, it stays in range bound for months, followed by explosive movements. How do we predict such explosive moves before it happens. In order to find that, lets first find out historical price data of Nifty since 1994.
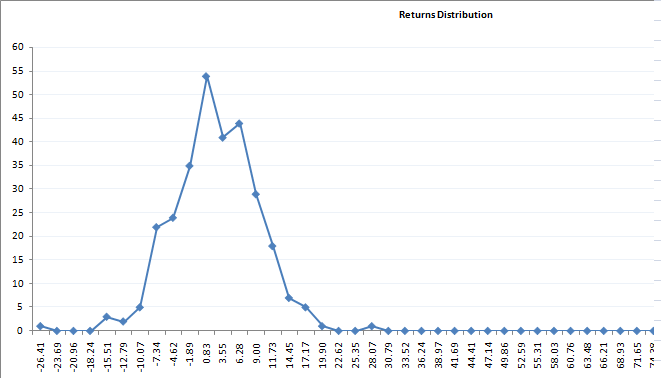
This is the monthly return distribution of Nifty, as you can see in below chart, most of the times, Nifty monthly % movement falls in the range of -2% to +2% and rest of the time it has seen violent moves.
There was an article published which mentioned
“Markets are not used to such lackluster movement. The Nifty moves sharply whenever it ends two or more consecutive expiries within a range of +2% or -2%,” Apurva Sheth has opined
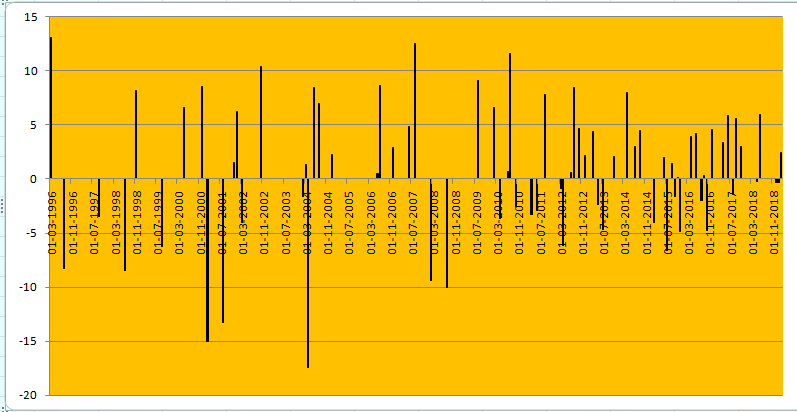
We ran a data analysis to find out whenever Nifty closed in the range of -2% to +2%, how much % Nifty moved in the following month and this is what we found out. Prior to 2008/09, there were occurances where Nifty moved down more than -10% to -15%, however post 2008–09 most of the movements were on the upper side, where 60% of the time Nifty moved up the following month after consolidation.
We even digged the data further to find out what would have happened, if considered taking the trade if Nifty monthly close is between -1% to +1%.
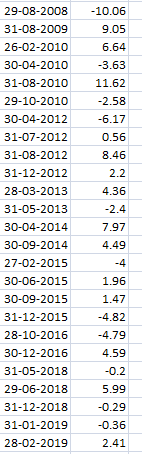
This will limit down the trades further and could increase accuracy as well, where in last 22 years, 34 months it triggered trades with total returns of around 71%. As you can see above, there were many instances we could see explosive moves in Nifty in the following months, when Nifty closed between -1% to +1%.
So what would be ideal strategy we can build around this data? As per the above analysis for last 20+ years, the data suggest certain degree of movement could be witnessed if Nifty monthly close is between -2% to +2% or -1% to +1%. So traders can take long straddle/strangle with options which could result in positive returns when Nifty moves violently. Here’s the link to find out historical options data for any given date/strikes
https://www.nseindia.com/products/content/derivatives/equities/historical_fo.htm
Here’s the detailed excel analysis report for anybody who wants to analyse further. Click here
If you liked this article, please do share share it (Whatsapp, Twitter) with other Traders/Investors.