

Are you a trader who did an extensive back test of your trading strategy only to witness the worst performance when you traded live? Wondering why your real live results are not matching with your back test results? Then this article is for you. Gone are the days when you need to spend so much of time and effort to back test a simple trading logic. Now with many no code platforms available across the globe, it is much easier to back test your trading strategy at a click of a button. With increase in tech, increase in problem happens, not many do the back testing correctly.
In this article will explain how to back test a trading strategy correctly. Many traders do the mistake of jumping into the complete data directly and starts back testing their logic with the given data sets. Say if you want to back test a simple straddle strategy, you run the back test from 2017 to 2022 and see how the strategy performed.
When we back test normally, we want to cover 5 to 10 years of historical data because we wanted to see how the strategy performed during 2008 global financial crisis.
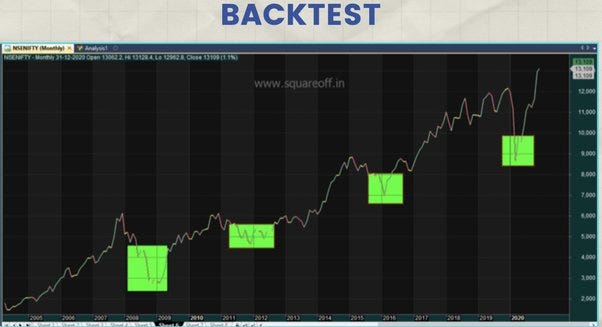
And how it performed during 2016 Brexit, demonetization , and year like 2020 where Corona crash happened. Basically, we wanted to make sure our trading system doesn’t lose its edge when market turns volatile, so many experts suggest you to back test with large data sets.
The ideal way it to segregate your data into two, in sample and out sample. Consider year 2017 to 2018 as in sample data, test your logic/trading strategy with this data set first. Then consider 2019 to 2020 as your out sample data, where you can validate what you have tested in 2017 to 2019.

Instead of directly testing from 2017 to 2020, we are initially testing with one data set and checking how the strategy is performing, if there is any change in stop loss or target is required, we change those parameters and try to see the final results. If the over all results are satisfying, we test the same logic with same parameters in out sample data and validate if its working well.
If its working well with out sample data as well, then it means that your parameters are robust not very specific or curve fit in nature. If the results drastically vary with your out sample data(2019 to 2020), then it means you were trying hard with your in sample data (2017 to 2018) to tweak multiple parameters where you considered market noise for getting the highest profitable result.
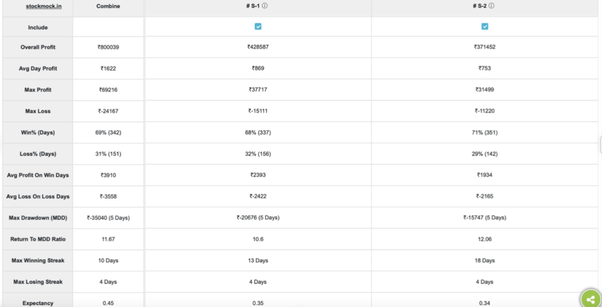
Let us consider the following example. Say I have two strategy, 920 Bank Nifty Short straddle strategy with 25% stop loss on each leg and 50% stop loss on each leg. Where I want to find out which trading strategy out of the two is more profitable?
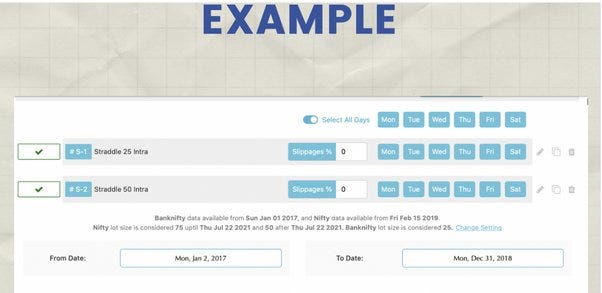
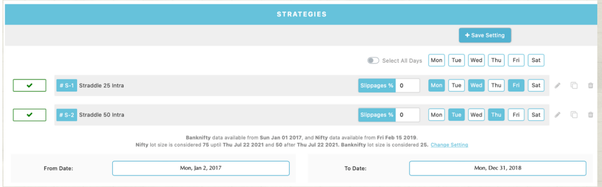
Am trying to test both the strategy, one with 25% stop loss and other with 50% stop loss to find which gives me the highest profits and I want to go with that one. I have considered backtest period from 2017 to 2018.
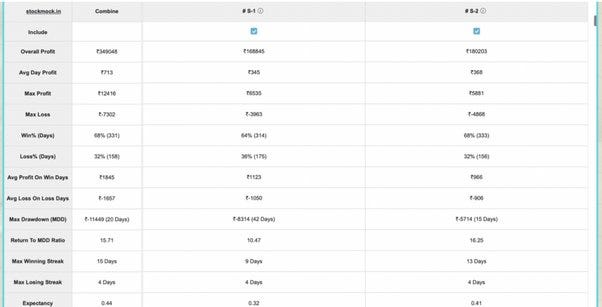
It gave me the result instantly, where profits from 50% stop loss strategy has given highest profits than 25% stop loss during the period 2017 to 2018.
So if we are at year 2019, what will we think? We will assume that 50% stop loss is optimal than 25% stop loss, so we should start trading the bank nifty 920 short straddle strategy with 50% stop loss. But I did a similar testing with the out sample data and found out that profits from 50% stop loss method is not so high, when we dig deep we found that for the period 2019 to 2020 25% stop loss system has given highest profits.
What was best for 2017 to 2018 is not best for 2019 to 2020. Market structure keeps changing, but market behaviour doesn’t change. What we were doing wrong was we were trying to fit in our rules with market data, we were hitting hard with our data to find that optimal stop loss which we thought is the holy grail parameter. So when you go live with such optimal stop loss parameters, it need not work in live markets when you tweak so much with SL in the past data.
Optimization:
Many beginners do this mistake, they want to find out which kind of strategy should they run of which kind of days. Say I want to run 920 short straddle strategy with 25% stop loss on some days and other days I want to run with 50% stop loss. Now they want to figure on which days what SL gives them the highest profits.
Platforms like Stockmock gives features like optimizer where with a click of a button you can find which one is best. It automatically analyses the given data sets and tells you which stop loss % is better on which days.
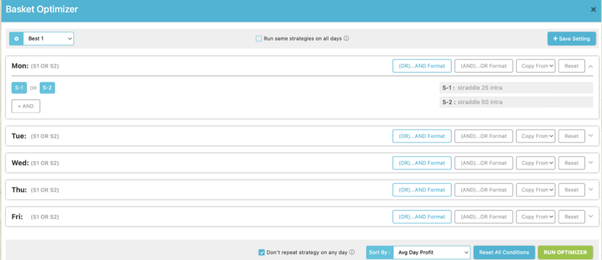
Lets take the same period 2017 to 2018 where the backtest optimiser calculated and gave us the final result which states that we should run
920 Short straddle strategy with 25% SL on Monday, Wed and Fri.
and
920 Short straddle strategy with 50% SL on Tuesday and Thursday.
Now the result looks like a holy grail to most beginners because they think, instead of running a strategy with fixed stop loss on all days, if I run with above combination I end up making maximum profits. So they go ahead and deploy it.
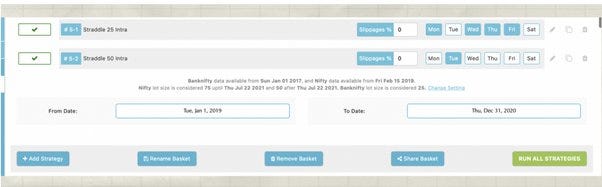
But if run the same optimizer for the period 2019 to 2020, the result changes completely. It shows expects Tuesday, I should 920 short straddle strategy with 25% stop loss and only on Tuesday I should run with 50% stop loss. So the combination changed completely now.
If you have gone live in 2019 and traded as per the previous suggested combination, you would have not seen such highest profits that you were expecting.
“Curve fitting is when a strategy or edge is not fit to market behavior, but market noise, leading to failure in live trading”
Consider a person like Bear Grylls wild life enthusiasts going to desert place to study about live species. He stays there for around 100 days to observe the nature, surroundings and tracking different types of animals living there. After 100 days, the wants to construct a shelter there, as he wants to extend his stay further to study more about wild life in the desert. Now when he builds a shelter, he believes that he doesn’t need to spend more money on building a concrete roof after all it’s a deserted place, it never rains here, so a normal roof is fine.

But within few days climate changed, there were continues rains for many days which eventually turned into a flood. He never imagined that it could rain like that, because in his 100 days of stay in that deserted place, never even once it rained. So he simply assumed that this place never gets rain, so he built his shelter accordingly.
Conclusion:
This is how most of the traders wrongly back test their trading strategy, based on what they have observed in markets in recent past, they tend to believe that’s how the market behaves throughout, and accordingly they design their trading strategy only to realize latter that they couldn’t handle It when it rains.
Less is more. Keep it simple always. Do not overcomplicate your strategy with multiple parameters. Don’t fine tune so much in finding the optimal Stop loss for each day. You would end up curve fitting your system.
Thanks for sharing this valuable lesson!