


People usually diversify their portfolio or allocate their capital to different asset classes. One of the subscriber from our telegram channel asked us, if there is a way to reduce his risk exposure to mutual funds without using hedging techniques.

But so far, people haven’t tried a quantitative approach to reduce the risk with mutual fund investments.
We have tried various parameters with quantitative techniques, ran many complex simulations to come up with a risk management model. None of them worked, later I figured that a simple parameter can reduce the risk considerably.
Its what we call it as MA10,which is nothing but a 10 month moving average.
10 Month moving average is almost equal to 200 days moving average, but why not 200 day MA? Why should we use 10 month MA?
Because, the daily moving average contains so much of noise due to daily fluctuations that we see in the market, using 10 month moving average will remove these noise.
Let’s see how it can help us in reducing the risk.
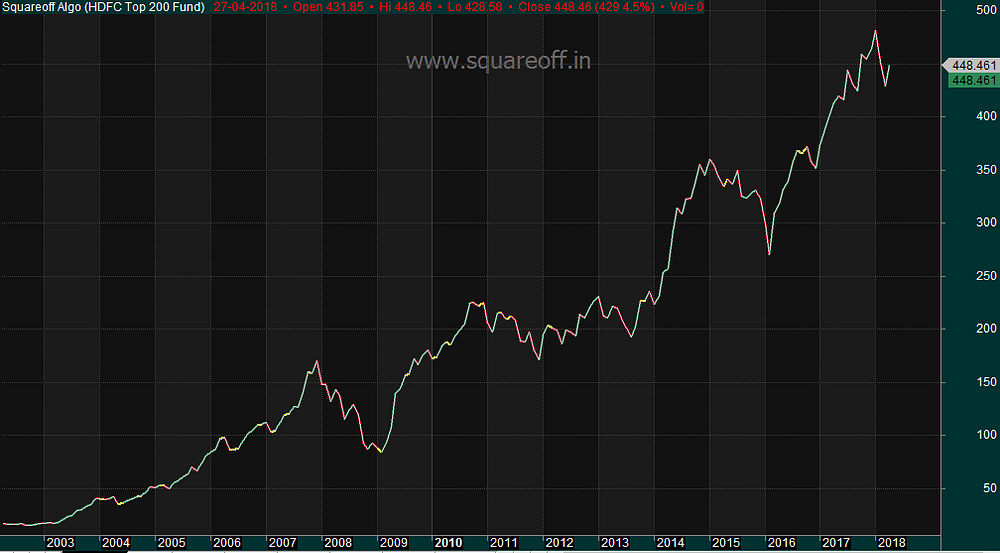
The above chart shows the chart of NAV of HDFC TOP 200 fund since inception.
Rs. 1 lakh Invested in 2002 at the time of inception has grown to Rs.25.9 lakhs by 2018.
That’s a CAGR of about 22.5%.
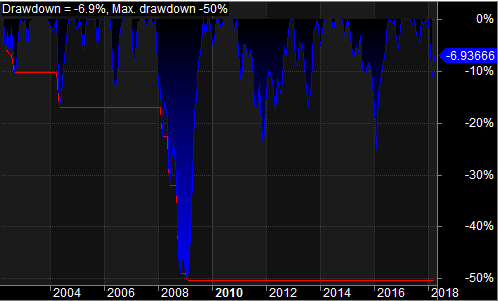
Sound great! What about the risk involved? Remember the period 2008? When market collapsed, 50% of your capital would have wiped out, whatever you gained prior to that would have been lost in the financial crisis?
How many investors can tolerate such downside fluctuation?
We tried implementing the MA10 rule.
Whenever NAV of a mutual fund goes below 10 month moving average, just exit from it. Re invest again in it,only when the NAV goes above 10 month moving average.
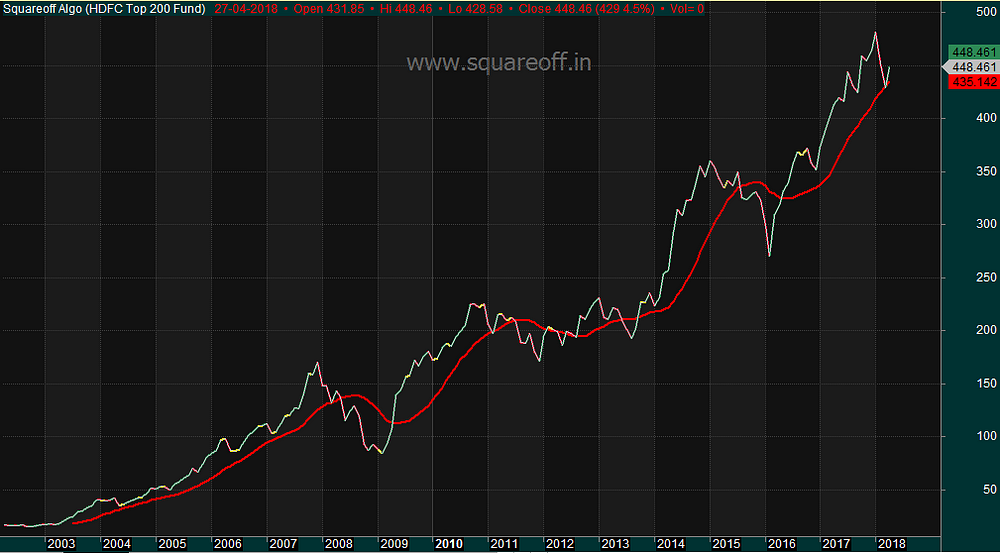
The above chart shows the NAV of HDFC TOP 200 fund. The red line is the 10 month moving average value plotted.
Rs. 1 lakh Invested in 2002 at the time of inception has grown to Rs.20 lakhs by 2018.
That’s a CAGR of about 20.5%.
Our CAGR dropped by 2%, how about the risk?
Risk reduced drastically.
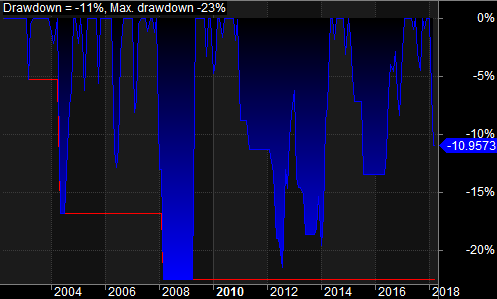
As you can see, the maximum drawdown was just 20% in 2008, when the whole world markets were crashing more than -55% in that year, your investments would have been down only by -20%.
During the other years, the average downside was just -5%.
We are able to reduce the risk in mutual fund investments by more than 60% by simply implementing a moving average with NAV of a fund.
Simple but very effective! try it out.
For more such analysis and stock market articles, follow us at our Telegram Channel and blog.
If you liked this article, please do share share it (Whatsapp, Twitter) with other Traders/Investors.
When the current nav is higher than 10 month moving average can you buy that mf? Does it apply to all categories of mutual fund or just to equities?
It applies to all equity mutual funds.
Can we use free switch options to debt fund or liquid? Or redeeming is a better option? Does Exit load factor also considered for the calculation? For SIPs, adding a lump-sum would benefit more or exit and re-enter is a better thing. Tx.
I am using Zerodha , I am investing on UTI NIFTY Direct Plan (NIFTY 50 bench marK
I don’t see an option to apply indictors on NAV on Zerodha coin or Kite app, is there any way to do in other platform.
Alternative steps : since it is tracked on NIFTY 50 bench mark, below steps to apply 10 month moving average, please confirm if it is right?
1. Open NIFTY 50 chart in KITE
2. Add simple moving average with period 10 and time frame 1 month ( which is average 10 monthly candle)
3. Or do I need to apply 210 days MA ( 10 months – apro 210 trading session) on time frame daily or 1 day
Hi,
Are there any free website/app which provides the NAV data of mutual funds in a Technical chart format for us to analyze as shown above?
You can refer define edge solutions
The problem with Monthly SMA is it’s one month late. Like in March 2020, we will get exit signal after the party is over.
Yes happens, but the same indicator saves us from 2008 global financial crisis from losing 55% and from dot com bubble burst.
In March 2020, entire fall completed by 26th and market went up after that. where as SMA will give sell signal on monthly close (31st March). How to handle such situations ?
If monthly close is below 10 ma, we exit. If it did not close below 10 ma, no exit
how can we get monthly moving average? only daily moving averages are available in all indicators including define edge solutions website
Yes, its not readily available, we have to download the data from AMFI and do the data analysis by ourselves.
please provide the algo (p/l) summary
Please check http://performance.squareoffbots.com/
please provide (P/L) reports for MF