
- January 18, 2020
- admin
- 0
We give utmost important to which stock to buy, we do multiple analysis, compare the balance sheet, check the company business, basically we use fundamental analysis to figure out which stock to buy and later get into technical analysis to know when to buy.

But we never focus on when to sell a stock.
Because, we convince ourselves that am a long term investor, I did all the analysis, am sure this stock is going to be multibagger, so why to worry about exit. Probably, i shall exit when i make 10x or 20x.
If we had given equal importance to when to exit a stock before even we entered, we would have not been holding many dead stock like Suzlon, Idea, Rcom etc by now.
In this article we shall discuss about when to sell a stock. What are the rules one can follow, so that we can exit a stock at the right time and limit our loss in case something goes wrong with our stock. What are the pros and cons with each of these exit signals.
Let’s take Yes Bank as example and apply all different exit signals.
200 Day moving average:
It is one of the most widely used indicator, a close below 200 day moving average usually indicates a bearish sign, and if a stock trade above 200 day moving average, then it is considered as bullish.
Pros:
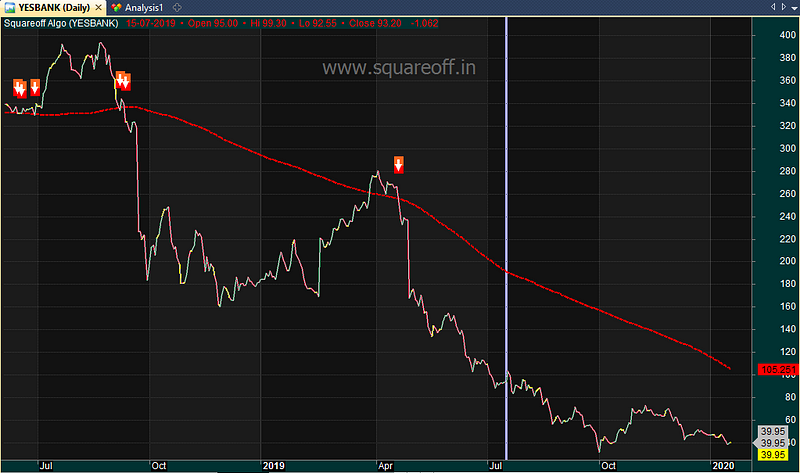
As you can see in the above chart, Yes Bank gave exit signal around 320, and after huge fall, stock moved up to 280 and closed above 200 day moving average, however in next couple of days, again it closed below 200 DMA at 260. Since then the stock has never moved up, it kept going down steadily and now trades around 39rs.
If you were holding Yes Bank and if you had exited when it closed below 200 DMA, you could have limited your loss to a greater extent.
Cons:
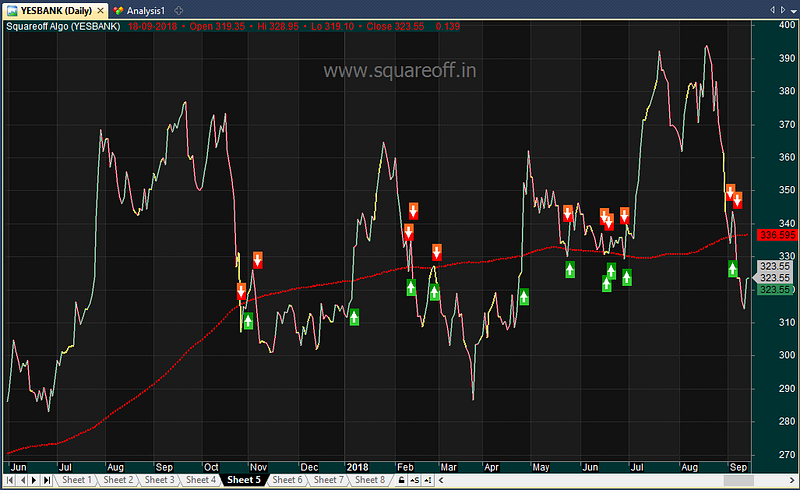
What is the draw back of using 200 DMA as exit signal? Noise. Since we apply this moving average on daily charts, at times we might face whipsaws, when stock trades in sideways movement, we might get multiple false breakouts/breakdowns. As you can see in the below chart, when Yes Bank was stuck in range bound period, the stock often closed above 200 DMA and within next few days, it closed below 200 DMA. It would be really difficult for an investor to take such entry/exits often.
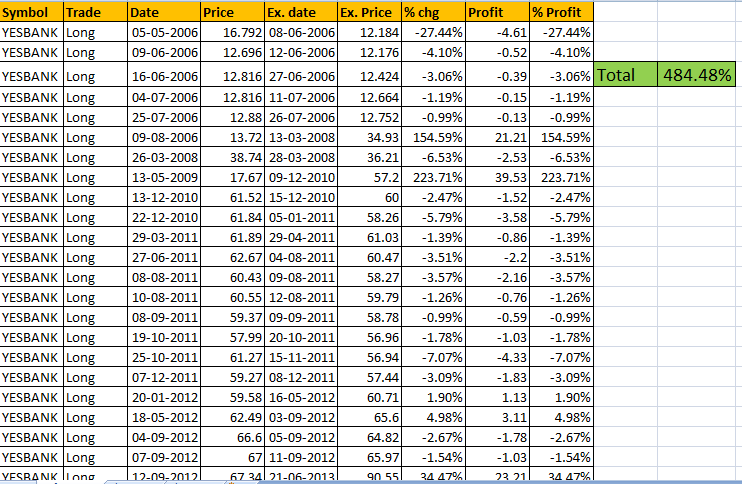
Here’s the result of 200 DMA exit strategy, if we followed the rules of Buy when stock closes above 200 day moving average and Sell it when stock closes below 200 day moving average. It has generated 484% returns with just 42 trades from listing date to till date.
10 MA:
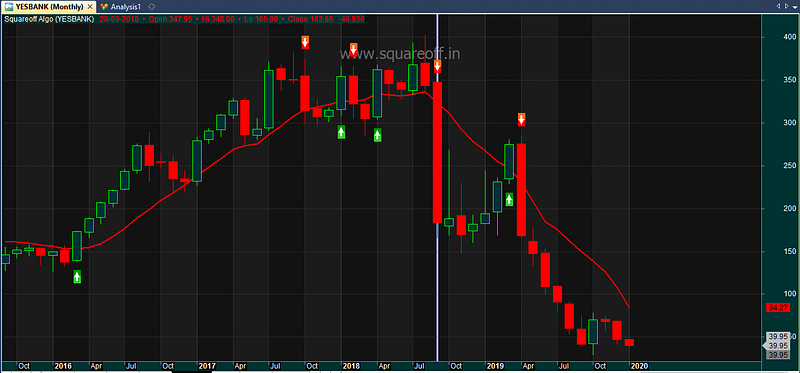
10 MA is nothing but 10 month moving average. Whats the difference between using a 200 Day moving average on daily chart and 10 MA on monthly chart? Moving to monthly chart reduces the noise.
Pros:
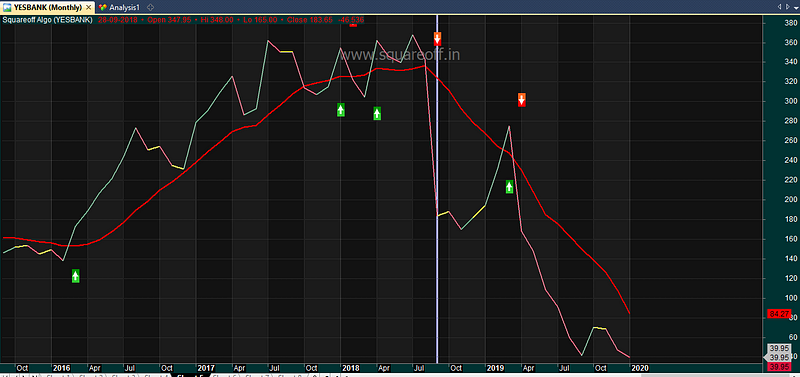
Higher the time frame, lower the false breakouts. As you can see in the below chart, even when a stock is in range bound, it doesn’t keep changing from buy to sell often.
Cons:
The only draw back is when we trade with monthly time frame, we need to wait for one whole month to complete to take buy/sell decision, so at times if stock tanks, we do not have any other than wait for the month to complete. In the month like sep 2018, Yes Bank closed down -40%, so we would have exited Rs.200 levels.
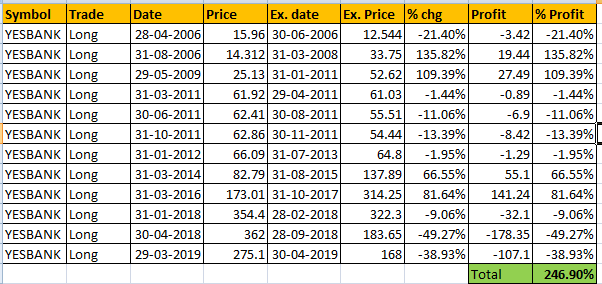
Here’s the result of 10 MA exit strategy, if we followed the rules of Buy when stock closes above 10 Month moving average and Sell it when stock closes below 10 Month moving average. It has generated 246% returns with just 12 trades from listing date to till date. Even though Yes Bank is considered one of the biggest wealth destroyer, following this simple rules would have not only helped you to exit at right moment, it helps us to make profits as well.
52 Week High/low:
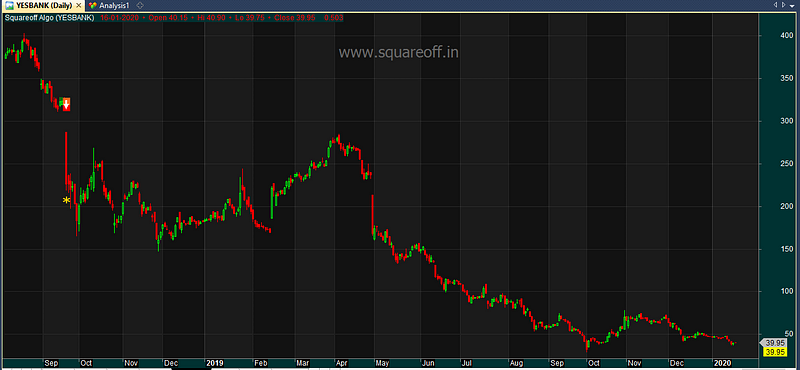
One of the most simplest and easy exit rule it, exit from the stock the moment it crosses below 52 week low price. As you can see from the below chart, when Yes Bank crashed on 21st Sep 2018, the stock hit 52 week low price of 285, we would have simply exited at 285 levels, but that day after hitting 52 week low, the stock kept on moving down and closed down -30%.
Pros:
After the stock has hit 52 week low price, even though it bounced up and trapped lot of traders, we would have never been fallen for that trap, since the rule states that we buy again only if it closes above 52 week high, it never touched that levels. Since then,it kept on moving down and trades around Rs.40 levels now.
Cons:
Even though the best thing is, in just one trade we were able to ride the trend from 90 levels to 400 levels, made 3x returns but since the rule is to exit only when 52 week low price is hit, we always have to leave some profits on the table.
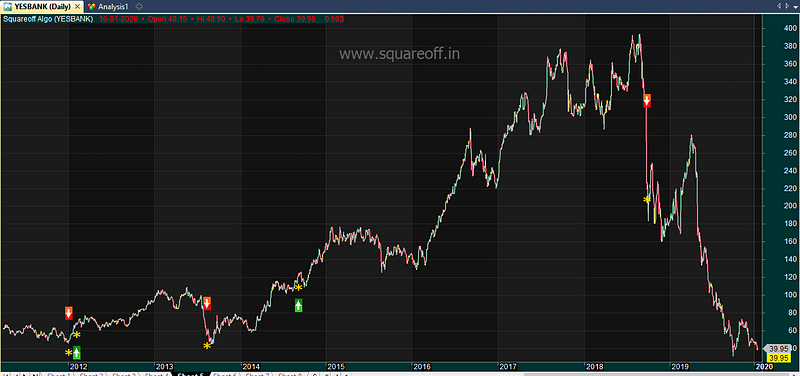
Here’s the result of 52 week high/low exit strategy, if we followed the rules of Buy when stock cross above 52 week high price and Sell it when stock cross below 52 week low price. It has generated 235% returns with just 5 trades from listing date to till date.

If you are wondering when to sell a stock, these are the some of simple and straight forward exit rules an investor can follow for any of the stocks in their portfolio. It helps you to exit at the right moment, before maximum damage happens.
If you liked this article, please do share share it (Whatsapp, Twitter) with other Traders/Investors.


